
Automatic graphics generation
I've always been fascinated by the idea of automatically generating engineering grade graphics from simple geometry data, compatible with quick field assessments.
Last year, I worked in a project I baptized EasyMetric to do exactly that. However, the project quickly lost traction as I underwent a major carreer change.
I would like to recover from my memory some of the logic behind that project and start creating capacity to build engineering grade drawings for piping systems.
I've decided to use a very simple tree model to capture data about piping systems. Although not perfect, this tree model has proven to be able to model most piping systems—at least most process and firefighting systems I've had the chance to come across.
A spool begins in a single source point, from which a root grows. From it, branches may grow at any point along the root, and recursively, branches may grow at any point along branches. Growth is in 3D. For simplicity, I will assume the source point is always at the origin.
What is the simplest way to submit data to build such a tree? To me, that is always a list (who doesn't like ticking off items out of a list?). Let me use some good old pen and paper to devise a simple example system, and then let's use some coding to turn it into a nice vector graphic.
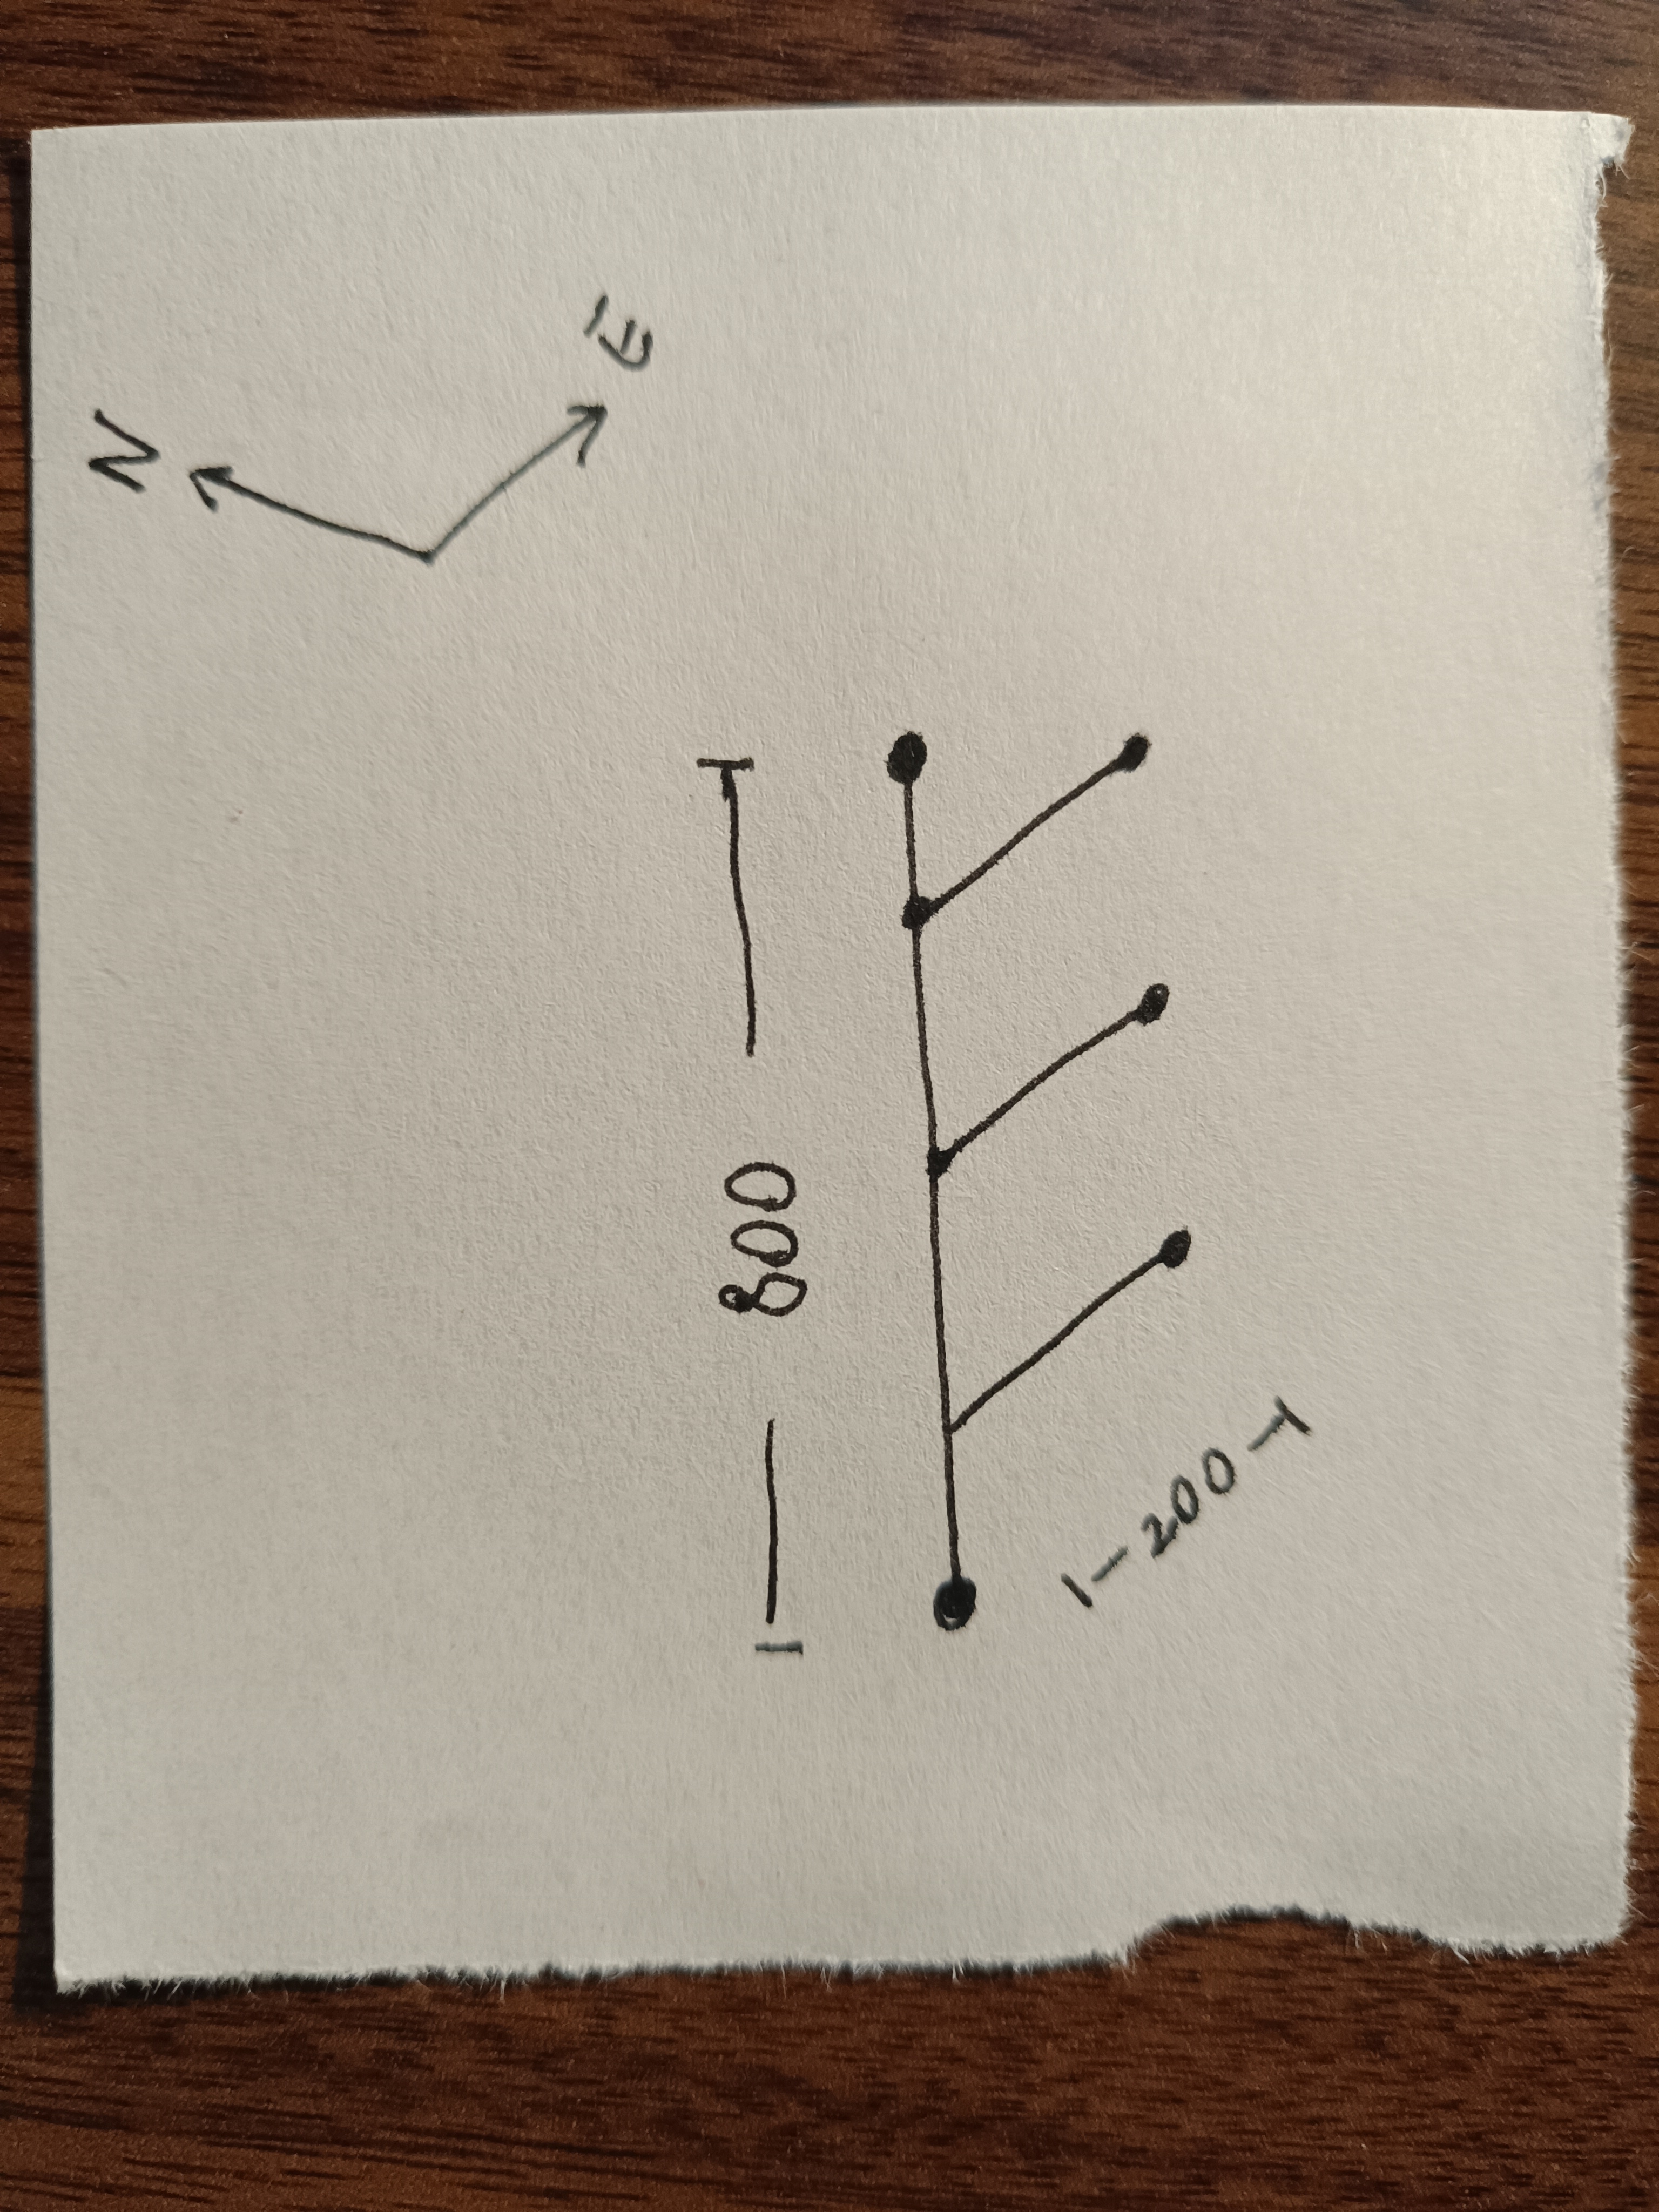
In the system above, we have a vertical pipe section from which three equally spaced branches grow eastward. This is the data, in list form, that would represent this pipe system in my old EasyMetric project.
| # | e | n | u | o | f |
|---|---|---|---|---|---|
| 0 | 0 | 0 | 800 | -1 | 0 |
| 1 | 200 | 0 | 0 | 0 | 200 |
| 2 | 200 | 0 | 0 | 0 | 400 |
| 3 | 200 | 0 | 0 | 0 | 600 |
The first column is an index. The next three columns represent directions east, north and up. It's basically the direction in which each pipe section is going. The next column represents origin, that is, from which other branch the current branch stems out of (as you can see, I used -1 to indicate that the root does not originate from other branch). Finally, the last column represents the offset, which is how far along the mother branch this current branch is born (here, -1 means that the branch is born at the endpoint of its mother).
I found this way of providing geometry data for piping systems very versatile and intuitive. As designers, it's hard to deal with absolute coordinates, but you sure know where your section is coming from and how far along the axis of its origin your derivation is supposed to start. With a tree system, you can represent a manifold-like system like this one, by having multiple branches come out of the same root, or you can represent a more traditional, single route system, by using as origin the endpoint of the previous branch. You can even have all sorts of crazy combinations of both!
Now, after writing some code, let me show you the result of using this very simple model. I used JavaScript because it's web-ready.
If you know how to inspect elements in a HTML document, you can see the geometry behind this little drawing. The numbers are not simple, but the math is. Here is what I did:
First, I obtained the absolute 3D coordinates of the system. I assumed it all starts at the origin and I go adding vectors together as I course through the input data. When I have the absolute coordinates, I calculate the goemetric center of the 3D system, and turn this into the new origin. Then, I use the simplest projection matrix to go from 3D to 2D. Since I centered the 3D system around the origin, I now know for sure that the (0, 0) in 2D is inside the drawing. So my view box will simply be from the min x to the max x, and from the min y to the max y.
Then, I run a simple loop to create as many polylines as there are pipe section. Each pipe section is a nicely round-capped polyline element. And that's it! There is a bit more math if you want to print the drawings to physical paper. But I will explain that in another article.
For the time being and just to have some fun, let us see how the code I wrote works for some simple models.
Imagine we have to go up half a meter from the source point. Then, move horizontally eastwards 600mm. From this horizontal branchline, two feed lines come back down 250mm at 200mm from the elbow and then at 400mm from the elbow. Our input data would look like this:
| # | e | n | u | o | f |
|---|---|---|---|---|---|
| 0 | 0 | 0 | 500 | -1 | -1 |
| 1 | 600 | 0 | 0 | 0 | -1 |
| 2 | 0 | 0 | -250 | 1 | 200 |
| 3 | 0 | 0 | -250 | 1 | 400 |
Here's the result:
Finally, let us create something more interesting (and potentially useful). Imagine a square-shaped underground main loop, going 20 meters in all four directions. Spaced every four meters without considering the corners, there are 3 meter high standpipes. The data would look like this:
| # | e | n | u | o | f |
|---|---|---|---|---|---|
| 0 | 20 | 0 | 0 | -1 | -1 |
| 1 | 0 | 20 | 0 | 0 | -1 |
| 2 | -20 | 0 | 0 | 1 | -1 |
| 3 | 0 | -20 | 0 | 2 | -1 |
| 4 | 0 | 0 | 3 | 0 | 4 |
| 5 | 0 | 0 | 3 | 0 | 8 |
| 6 | 0 | 0 | 3 | 0 | 12 |
| 7 | 0 | 0 | 3 | 0 | 16 |
| 8 | 0 | 0 | 3 | 1 | 4 |
| 9 | 0 | 0 | 3 | 1 | 8 |
| 10 | 0 | 0 | 3 | 1 | 12 |
| 11 | 0 | 0 | 3 | 1 | 16 |
| 12 | 0 | 0 | 3 | 2 | 4 |
| 13 | 0 | 0 | 3 | 2 | 8 |
| 14 | 0 | 0 | 3 | 2 | 12 |
| 15 | 0 | 0 | 3 | 2 | 16 |
| 16 | 0 | 0 | 3 | 3 | 4 |
| 17 | 0 | 0 | 3 | 3 | 8 |
| 18 | 0 | 0 | 3 | 3 | 12 |
| 19 | 0 | 0 | 3 | 3 | 16 |
Here is the result:
See you soon with more piping and coding!